
This makes the UK uncompetitive and leads to job losses not only in industry (e.g. chemicals, steel and ceramics ) but also in commerce (hospitality, retail etc.)
Are you ready to help us. Become a volunteer!
Join UsAre you ready to help us. Become a volunteer!
Join Us
This makes the UK uncompetitive and leads to job losses not only in industry (e.g. chemicals, steel and ceramics ) but also in commerce (hospitality, retail etc.)
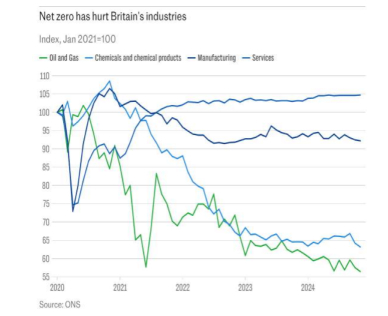
This graphic based on information from the Office of National Statistics shows the steep decline in the chemical, manufacturing, oil and gas and service industries since 2020.
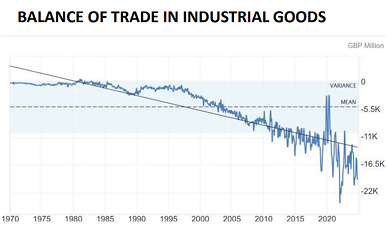
There were major distortions during the Covid years but the trend in industrial output over the years is in a steep downward trend. A major factor in this is the cost of energy. The trade imbalance is made worse by the fact that most of the material for solar and wind farms are currently imported.
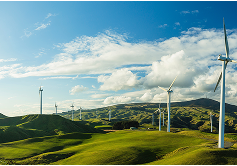

The average supply of wind power to the grid over the past 12 months was 28.2 % of demand. This masks the fact that at 4.40 am on 22nd January 2025 wind only supplied 131 MW or 0.27% of demand (Source Elexon BMRS).
The average import in 2024 of electricity was 16.3% of demand, On 15 July 2024 we imported 36% of grid demand (Source NESO).
Average demand in 2024 was 29 GW. This masks the fact that peak demand was 50 GW .

There have been several major fires at grid-scale battery arrays in recent years. The most recent were on January 18 2025, in California (see picture), 29th January 2025 in Melbourne and 19th February 2025 in East Tilbury in Essex.There have been 38 deaths in North America and 23 deaths in Korea from lithium-ion fires.

The conclusions of a recent research paper by Professors Edwards and Dobson of Oxford University) were that large battery arrays have the potential to cause catastrophic disaster not only from the fire but also from the release of hazardous substances. To learn more go to Factsheets to download the data sheet.
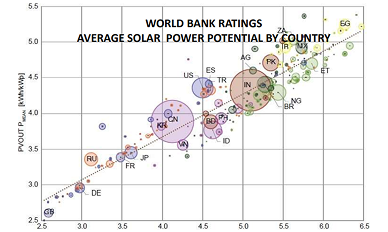
Out of 230 countries assessed by the World Bank for solar potential, the UK (bottom left in the graphic) came in at 229th. Only Ireland fared worse. Total supply in 2024 was 5.5% of demand.
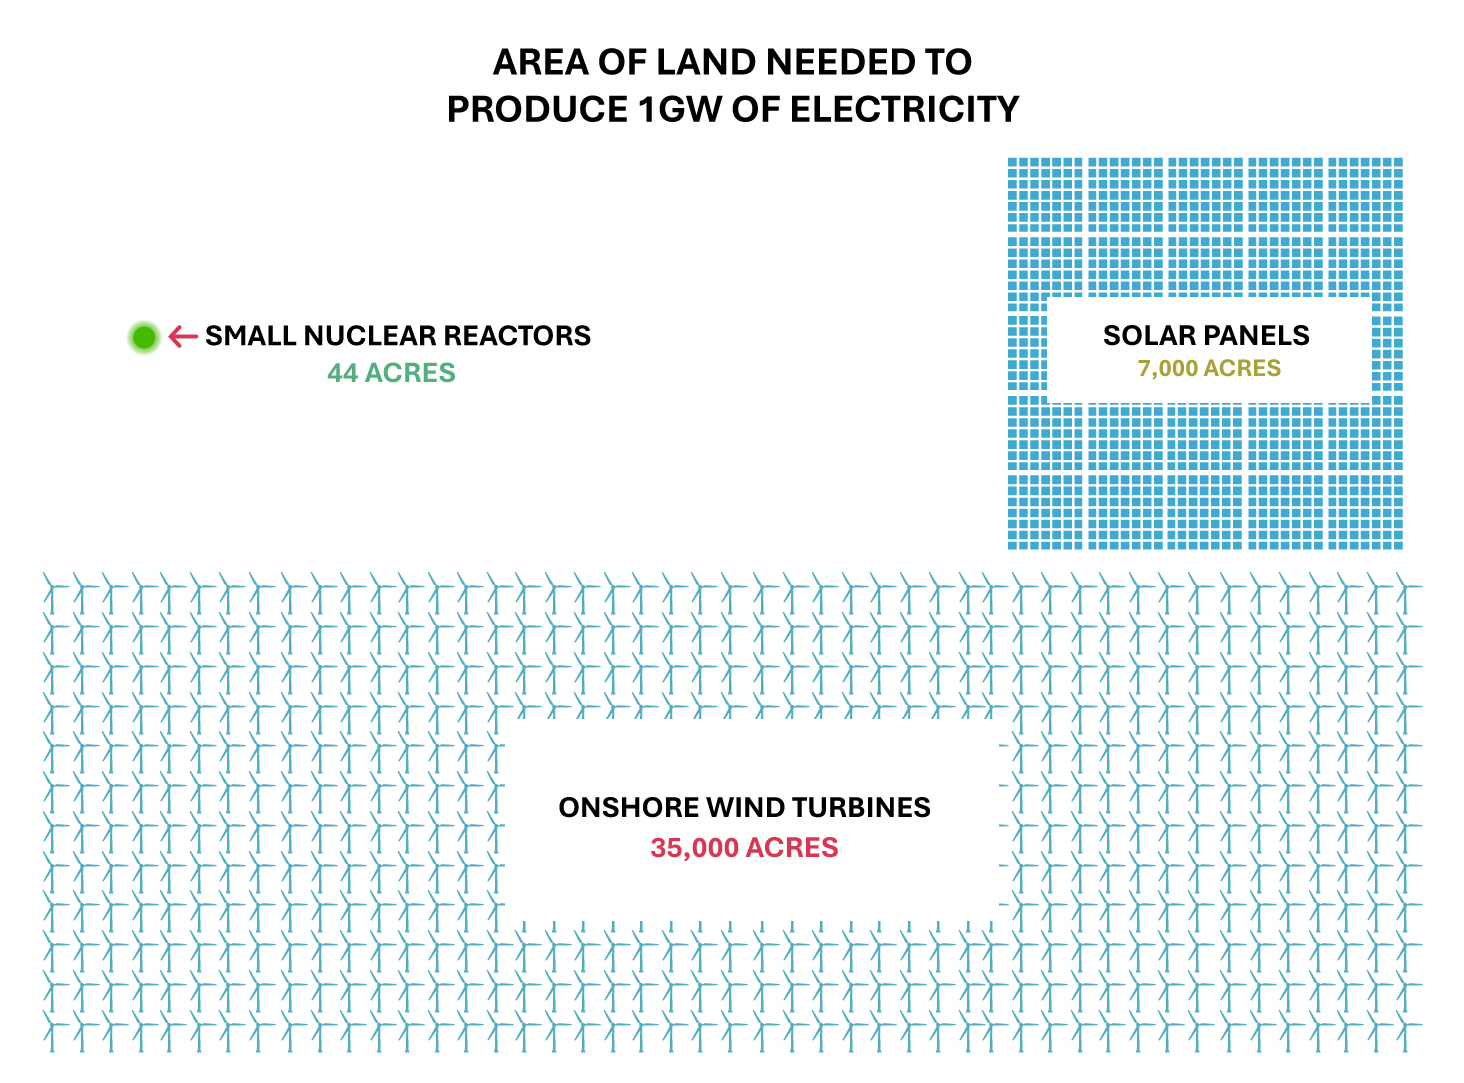
SMRs typically use 44 acres per GW of capacity (17.3 acres for 390MW) . Solar Farms (which only supplied 5.5 % of grid demand in 2024) need on average 7000 acres per GW and onshore wind farms use about 35,000 acres per GW.

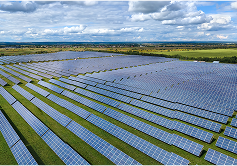
Ed Miliband is plotting a massive expansion of solar farm capacity from 17 GW in 2024 to about 70GW in a decade’s time.
The above mentioned solar farms capacity of 17GW produced just 5.5% of our electricity in 2024. Nuclear power capacity was 5.9 GW in 2024 and it produced 14.1% of the grid’s electricity.
In other words, it would require about 43GW of solar to produce the same amount of electricity as our (outdated) current fleet of nuclear power stations.

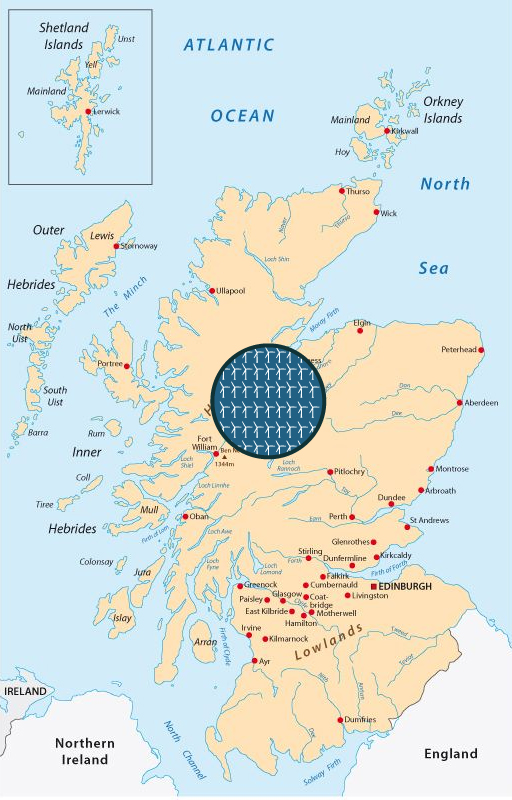
The current total of actual and planned onshore wind projects in Scotland could be up 30,000 MW. Using a figure of 55 acres per MW this would require 1,650,000 acres of land. Assuming that most of the wind would be installed in the windy highland area this is a graphic showing approximately how much of the beautiful Highland area could be covered in windmills.
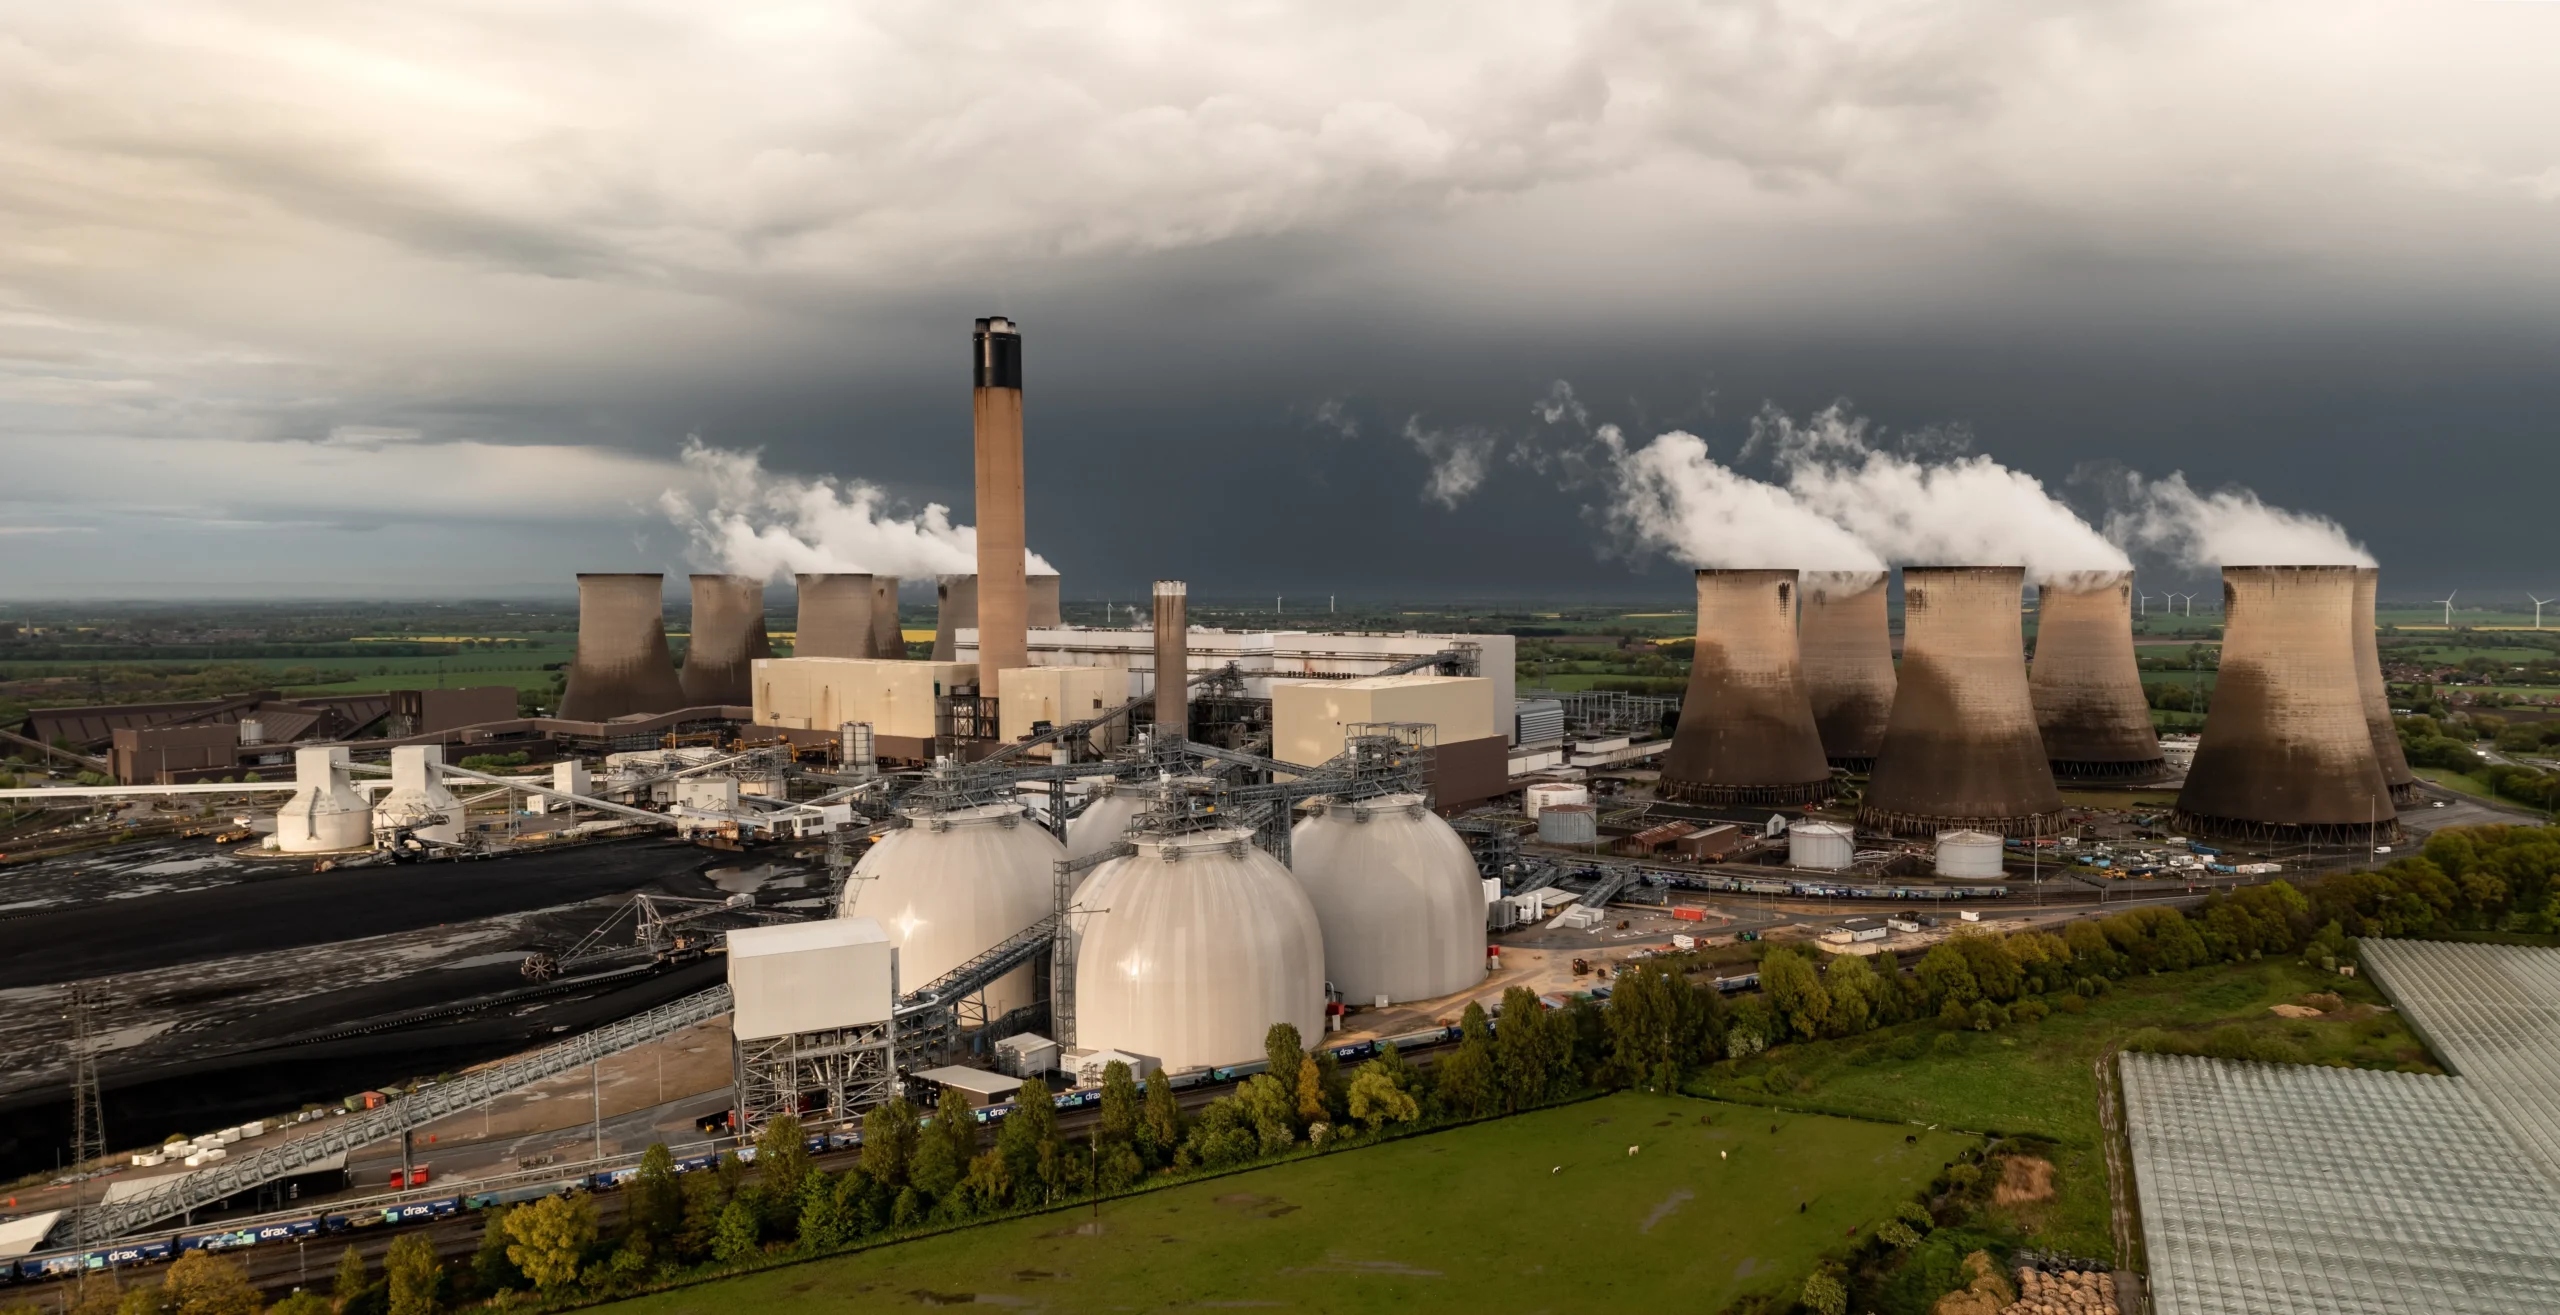
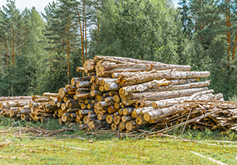
Drax, the only large-scale wood burning power plant in the world is the largest single emitter of CO2 in the UK. Emissions are at Drax are 18% more per kW/h than from coal, 45% more than oil and 60% more than gas. Yet, it is described as Britain’s cleanest fossil fuel power generator and is claimed to have the lowest carbon emissions because the UK Government decrees the emissions occur in North America where the trees grow not in the UK where they are burnt. Subsidies to Drax are forecast to rise to £1.7bn per year.

Contact Us